


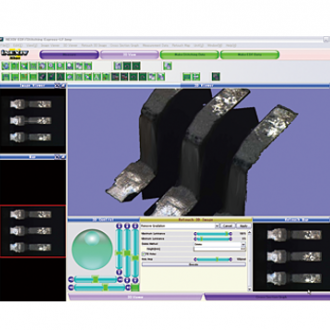
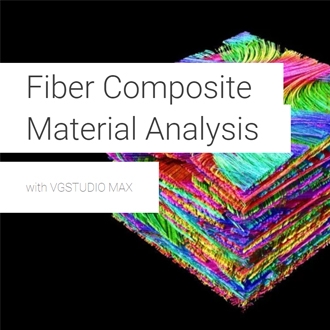
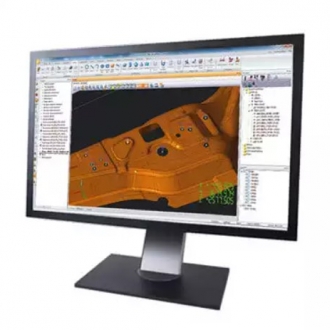
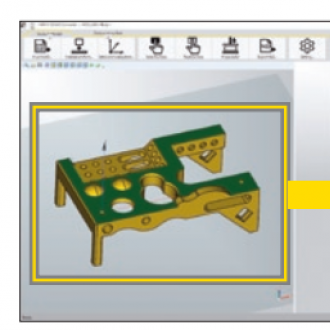
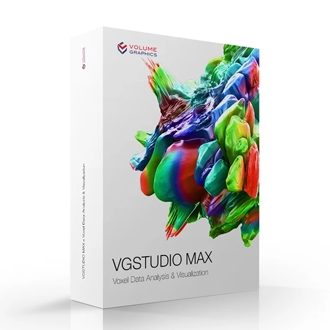
Fiber Composite Material Analysis wirh VGStudioMax
Fiber Composite Material Analysis Features
VGSTUDIO MAX offers analysis modes for each class of fiber composite material and manufacturing process. No matter if you work with short fiber-reinforced materials in an injection molding process, long fiber compression-molded parts, or even with woven fabrics or unidirectional fibers—the software has an analysis mode for it all.
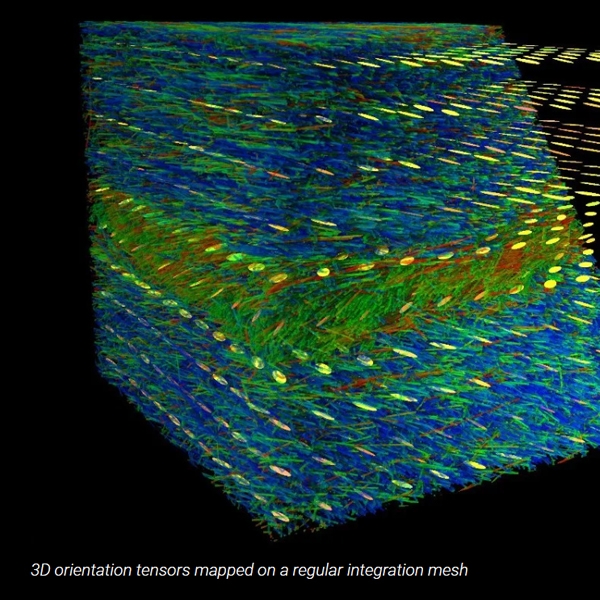
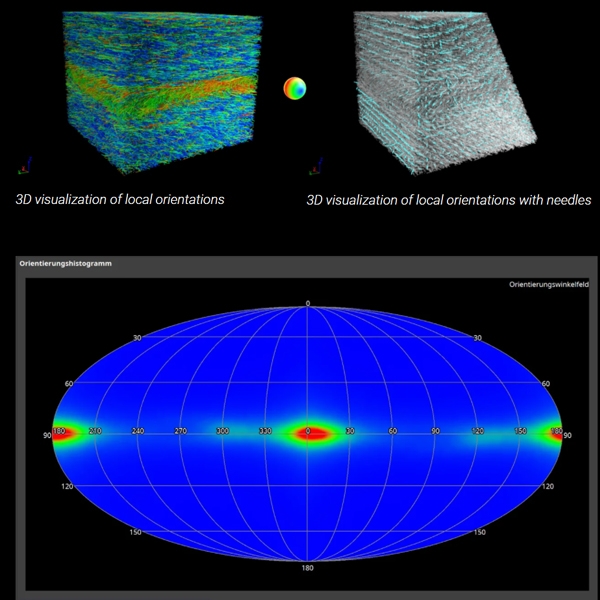
Spatial Orientation Mode
Our standard mode is very flexible with respect to the visualization of local orientations in 3D. Use it to take a first look into your fiber-reinforced material and get an idea of the orientation distribution.
In this mode, you can:
- Calculate the local orientation.
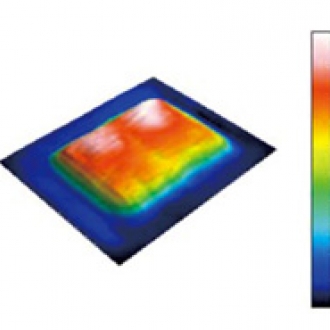
- Visualize local orientations either with a color overlay or with three-dimensional needles to gain a qualitative understanding of the fiber orientation inside your sample or component.
- Investigate the global orientation distribution in 3D as a heatmap on an equatorial, sphere, or polar plot.
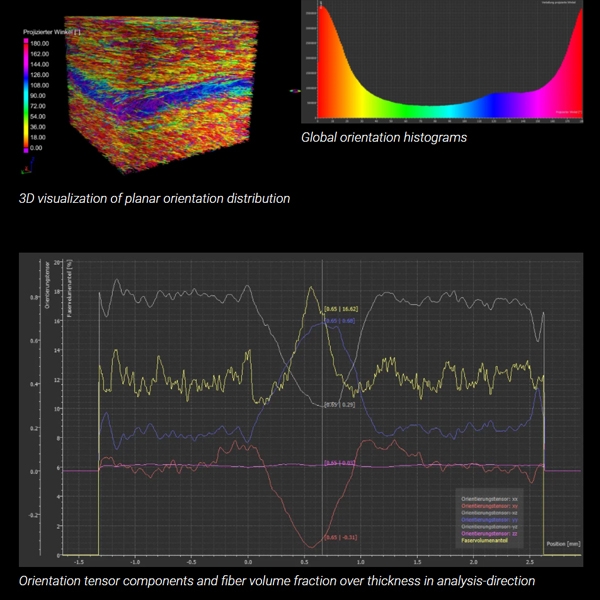
Use planar projection mode for planar parts in which the orientation changes over thickness. It is the mode of choice for injection-molded short fiber-reinforced materials, but also for long fiber compression-molded parts where different flow conditions lead to skin-core effects resulting in different orientation states over thickness.
In this mode, you can:
- Visualize the planar orientation distribution on an RGB color wheel specifying a unique orientation within the analysis plane.
- Derive global orientation histograms projected to the analysis plane.
- Plot 3D orientation tensor components and fiber volume fraction over thickness perpendicular to the analysis plane.
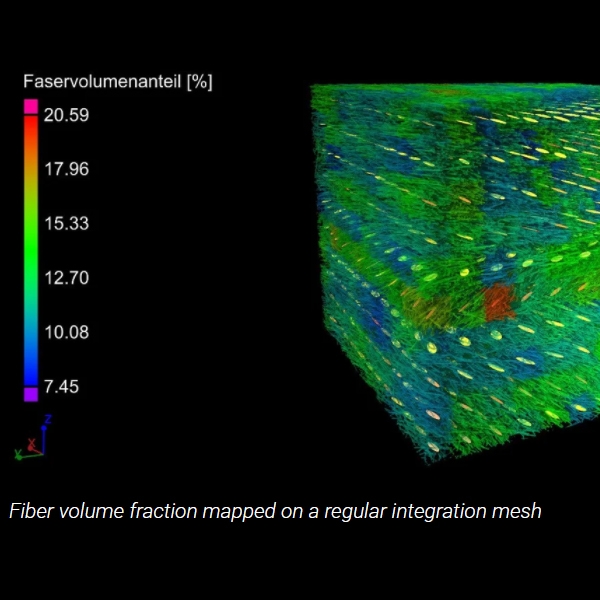
Use mesh mode to generate input data for mechanical or thermal simulations or to validate process simulations.
In this mode, you can:
- Evaluate the orientation tensor, including the corresponding eigenvalues and eigenvectors, the fiber volume fraction, and the matrix porosity* for each mesh cell.
- Visualize fiber volume fraction and orientation tensors and their principal orientations in 2D or 3D.
- Export results as .csv files for the use in 3rd party finite element analysis (FEA) software.
- Create simple regular volume meshes. Complex shaped volume meshes can either be imported (Patran, Nastran, Abaqus, Magma) or generated using the Volume Meshing Module.
- Extrude shell meshes with one click and set the numbers of cells in thickness direction of the structure.
*Porosity/Inclusion Analysis Module required
Planar Mesh Mode
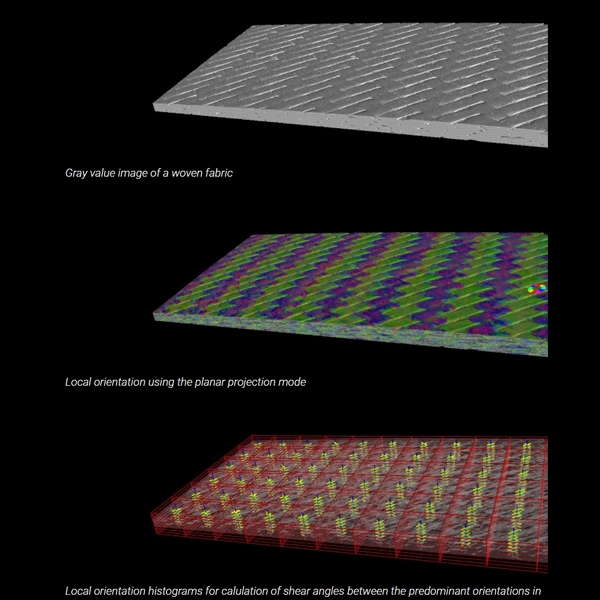
Use planar mesh mode for sheet-like structures with almost planar orientation distributions (e.g., most composites manufactured by compression molding), especially woven fabrics.
In this mode, you can:
- Derive local planar histograms for each mesh cell.
- Evaluate main directions of the locals histograms and the deviation angles in cases where the orientation tensor does not provide meaningful information, which is useful for woven fabrics.
- Compute orientation tensors, fiber volume fraction, and matrix porosity.*
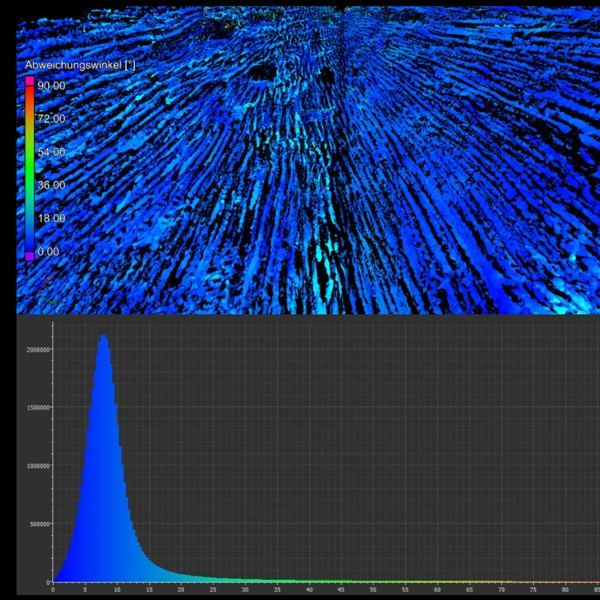
Use reference orientation mode for materials with unidirectional orientation distributions, like pultruded materials, 3D-printed fiber material in certain regions, or natural material, like wood.
In this mode, you can:
- Evaluate the deviation between the local orientation and a global reference orientation and visualize it via color coding.
- Plot a global deviation angle histogram.
Related Products
-
 New
NewV510Ai Vision Pro
-
 New
NewV810Ai QX1 Smart 3D AXI System
-
 New
NewViTrox Smart Camera (XC330 Ser…
-
 New
NewLV150NA LED
-
 New
NewF40s
-
 New
NewPixit Zoom
-
 Hot
HotMC4K-Pro
-
 New
NewMA200 LED
-
 New
NewLV150N LED
-
 New
NewH120 – High-Resolution Handhel…
-
 New
NewSLK25 Laser Scanner – High Acc…
-
 New
NewXC65Dx – Cross Laser Scanner f…
-
 New
NewLC15Dx – The Highest-Accuracy …
-
 New
NewL100NX CMM Laser Scanner
-
 New
NewDigital Sight DS-100
-
 New
NewFM-LXR
-
 New
NewOPT SmartFlash-3020
-
 New
NewDigital Microscope Inspectis U…
-
 New
NewViTrox Smart Code Reader (XS S…
-
 New
NewViTrox Smart Camera (XC100 Ser…
-
 New
NewV510Ai DST
-
 New
NewV510Ai ST
-
 New
NewPX730i : Die Sorting & Vision …
-
 New
NewWiX AI: Wafer Vision Inspectio…
-
 New
NewV510Ai AOI for Advanced Packag…
-
 New
NewECLIPSE LV100N POL LED
-
 New
NewLV100NDA LED
-
 New
NewLV100ND LED
-
 Hot
HotMD830M-C Digital Camera
-
 New
NewMD830-C Digital Camera
-
 New
NewMC2000 Digital Camera
-
 New
NewMC500 Digital Camera
-
 New
NewJX 2000 All-in-one Microscope …
-
 New
NewDigital Sight DS-50M
-
 New
NewDigital Sight DS-10
-
 New
NewV510Ai R 6-AXIS
-
 New
NewTMS2400 C Micro.View+ Compact
-
 New
NewNEXIV VMZ-NWL200
-
HANDYSURF+
-
3R-JFIBER Movable tip industri…
-
Inspectis U30S
-
 Hot
HotSMZ25 and SMZ18 Stereo zoom mi…
-
 New
NewV9Ai Final Inspection (FI)
-
 New
NewV9Ai Coating Inspection (CI)
-
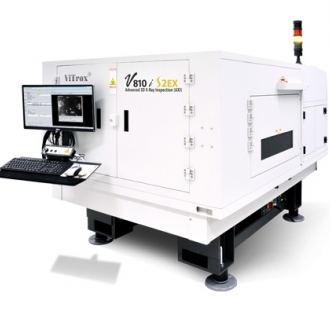
V810Ai S2EX
-
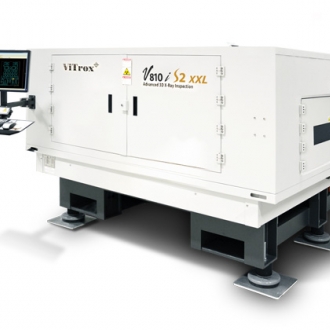
V810Ai S2 XXL
-
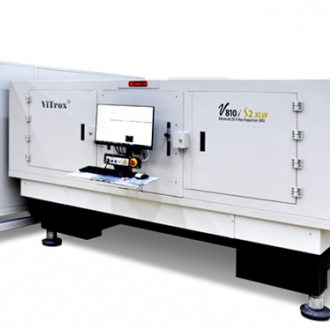
V810Ai S2 XLW
-
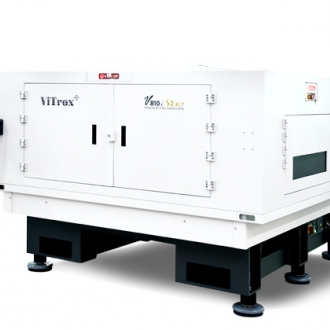
V810Ai S2 XLT
-
V810Ai S2 XLL
-
 New
NewV810Ai S3
-
V510Ai DUO
-
V510Ai XXL
-
V510Ai 4.0A
-
V510Ai XLW
-
V510Ai XL
-
V510Ai Optimus 3D
-
 New
NewV510i SE
-
 New
NewV510i Optimus 3D (for Advanced…
-
V310Ai SE
-
V310Ai XXL
-
V310Ai XL
-
V310Ai Optimus
-
 New
NewV310Ai Optimus (for Advanced P…
-
 New
NewTR1000SAi
-
 New
NewTR3000Ai
-
 New
NewTH3000Ai
-
 New
NewVR20Ai L PRO : Post Seal Visio…
-
 New
NewVR20Ai PRO
-
 New
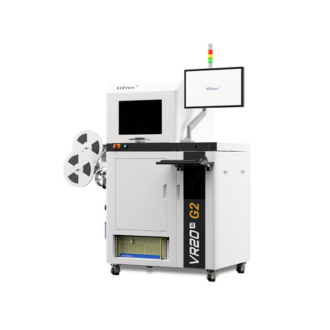
NewVR20Ai G2 : Post Seal Vision H…
-
 New
NewBottom Carrier Tape Inspection
-
 New
NewTape Seal Inspection
-
 New
NewIn-Pocket Inspection
-
 New
New3D & 5 Sided Inspection
-
 New
NewMark, Lead & Package Inspectio…
-
 New
NewOrientation Inspection
-
 Hot
HotNEXIV VMZ-S3020
-
 Hot
HotEDF/Stitching Express - Softwa…
-
 Hot
HotXT V 130C
-
 Hot
HotXT H 225 | Computed Tomography…
-
MCT225
-
SMZ445 & SMZ460 Stereoscopic Z…
-
 Hot
HotEclipse MA100N
-
Fiber Composite Material Analy…
-

The Extended Porosity/Inclusio…
-
 New
NewTmetric C20 3D camera
-
MAXIMA
-
CMM - CAMIO Software
-
 Hot
HotNEXIV VMZ-S4540
-
 Hot
HotNEXIV VMZ-S6555
-
 Hot
HotiNEXIV VMA-2520
-
 Hot
HotiNEXIV VMA-4540
-
 Hot
HotiNEXIV VMA-6555
-
 New
NewMountain Map - Software
-
 New
New3D CAD Converter - Software
-
 New
NewMapMeasure Pro - Software
-
 New
NewImageFit QC- Software
-
Custom Fit - Software
-
PolyWorks | Modeler
-
 New
NewPolyWorks | ReportLoop
-

PolyWorks | AR
-
 Hot
HotNIS Software
-
 Hot
HotMeasuring Microscope (MM-400)
-
 Hot
HotMeasuring Microscope (MM-800)
-
 Hot
HotE-Max software (DS-Type )
-
 New
NewCustom Create
-
Data Processor (DP-E1A)
-
 New
NewPolyWorks | PMI+Loop
-

PolyWorks | Talisman
-

PolyWorks | DataLoop
-
The Simple Solution for the Vi…
-
V-12B - 12" vertical optical c…
-
 Hot
HotExtended Depth of Focus (EDF) …
-
 Hot
HotTMS 2400
-
 Hot
HotPolyWorks | Inspector
-
 Hot
HotTMS 1400
-
 New
NewSURFCOM NEX
-
SURFCOM CREST DX/SD
-
CONTOURECORD 1600G
-

Wall Thickness analysis with V…
-
FM Series
-
FV Series
-

FLV Series
-
FT-ZERO ARS-F SYSTEM
-
 New
NewFR-XA
-
FR-X Series
-
LC-200R Series
-
FB-3000LC
-
 New
NewFTC-AS Series
-
 New
NewFTC-ASL Series
-
FTC-B255FS
-
FTC-D150A
-
 New
NewFTM-AX
-
FTM-EVO
-
FTP-1AH
-
 New
NewFTP-AX Series
-
 New
NewFTP-MX Series
-
CUTTING WHEEL
-
HOT MOUNTING COMPOUNDS
-
SILICON CABIDE ABRASIVE PAPERS
-
EZ-DISK and MANETIC BASE FOR S…
-

WATER BASE DIAMOND SLURRIES, M…
-

HIGH PURITY ALUMINA (99.9%) an…
-
POLISHING CLOTHS
-
Photonic Fiber Optics Illumina…
-
Loupe
-
Dial Test Indicators
-
Signal Gauge SC-2A
-
Signal Gauge S-9
-
Signal Gauge S-7
-
Signal Gauge S-5
-
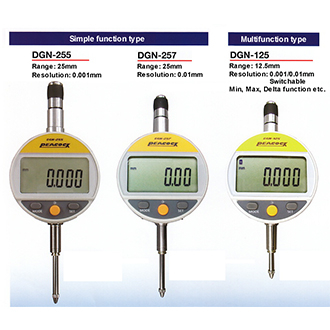
DIGITAL GAUGES -D/DL type
-
DIGITAL GAUGES -PND Type
-
DIGITAL GAUGES -DG type
-
Digital Counters
-
Dial Thickness Gauges
-
Dial Indicators
-
DIAL GAUGE STANDS & MAGNETIC S…
-
CALIPER GUAGE
-
HAYASHI_Korin KDR6142
-
HAYASHI LP-120 + HDR61WJ
-
TESTING STAND_M Series
-
TESTING STAND_K Series
-
TESTING STAND_KS-504H
-
TESTING STAND_KS-501H
-
TESTING STAND_KS-501E
-
PUSH-PULL GAUGES_MPC series
-
PUSH-PULL GAUGES_MPL series
-
PUSH-PULL GAUGES_MPS series
-
PUSH-PULL GAUGES_MP series
-
PUSH-PULL GAUGES_AP series
-
DIGITAL TORUGE CHECKER_DTC SER…
-
DIGITAL TORUGE CHECKER_ADT-C S…
-
DIGITAL FORCE GUAGES - ARFS SE…
-
DIGITAL FORCE GUAGES - ARF SER…
-
Cylinder Gauges
-
 New
NewALTERA C
-
 Hot
HotMicrendo Series
-
V20B - Large capacity vertical…
-
 Hot
HotFlexiVision 100
-

Nominal/Actual Comparison with…
-
SMZ745 & SMZ745T Stereoscopic …
-
 Hot
HotFlexilux Universal Borescope S…
-
 Hot
HotFiberscope Series
-
 Hot
HotEzyScope
-
 Hot
HotMotorized Stepper Stage For In…
-
Quadra-Check Series
-
 Hot
HotMotorised Stepper Stage For Up…
-
 Hot
HotPro Scan lll
-
Large Sample Non Contact Profi…
-
 Hot
HotNon Contact Flatness Measureme…
-
 Hot
HotNon Contact Flatness Measureme…
-
RONDCOM NEX Rs α
-

PolyWorks | Reviewer
-
 Hot
HotEclipse MA200
-
 Hot
HotVGStudioMax Software
-
 New
NewDigital Sight 1000
-
The Free Viewer App for Your 3…
-
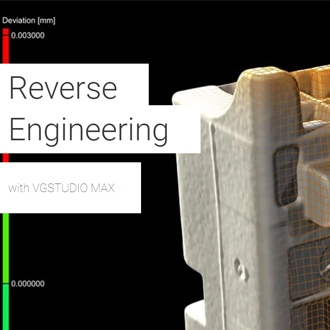
Reverse Engineering with VGStu…
-
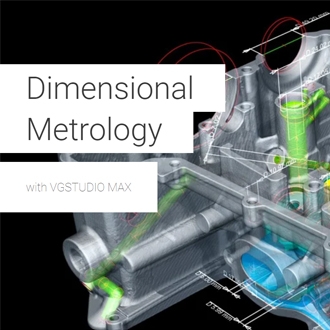
Coordinate Measurement Module …
-
 New
NewNew X-ray CT system with enhan…
-
 Hot
HotXT V 160
-
 Hot
HotE-MAX D Type
-
 Hot
HotStereo Microscope (Paralell) S…
-
 New
NewNEXIV VMF-K6555
-
NEXIV VMZ-H3030
-
 Hot
HotALTERA S
-
SMZ-2 Stereoscopic Zoom Micros…
-
 Hot
HotPorosity/Inclusion Analysis wi…
-
SCANTEK5
-
 Hot
HotData processor (DP-E1A)
-
APDIS MV4x0 Laser Radar
-
 Hot
HotALTERA M
-
 New
NewWELDinspect 4K
-
 New
NewBGA Inspection System
-
Digimicro MF-501
-
 Hot
HotEclipse LV150N
-
Eclipse LV100ND
-
Eclipse LV100N POL
-
Eclipse L200N Series
-
Eclipse L300N Series
-
Digimicro MF-1001
-
 Hot
HotNEXIV AutoMeasure Software
-
 New
NewCMM-Manager for iNEXIV Softwar…
-
DIGITAL FORCE GUAGES - ARF ser…
-
 New
NewNEXIV Remote Control SDK
-
TOUCH50
-
ALTERA SL
-
 New
NewNEXIV VMF-K3020